Hat tessellation help
![[Richard Russell]](https://distillery.matrixnetwork.co.uk:3004/applications/dashboard/design/images/defaulticon.png)
I've been trying to write a program to plot the so-called 'hat' tessellation (it's an aperiodic tessellation which solves the einstein problem, so long as reflections are allowed).
It's straightforward enough to plot an individual tile (there are 6 orientations, each with a reflection, so 12 possibilities in all) but I can't figure out how to do the actual tessellation.
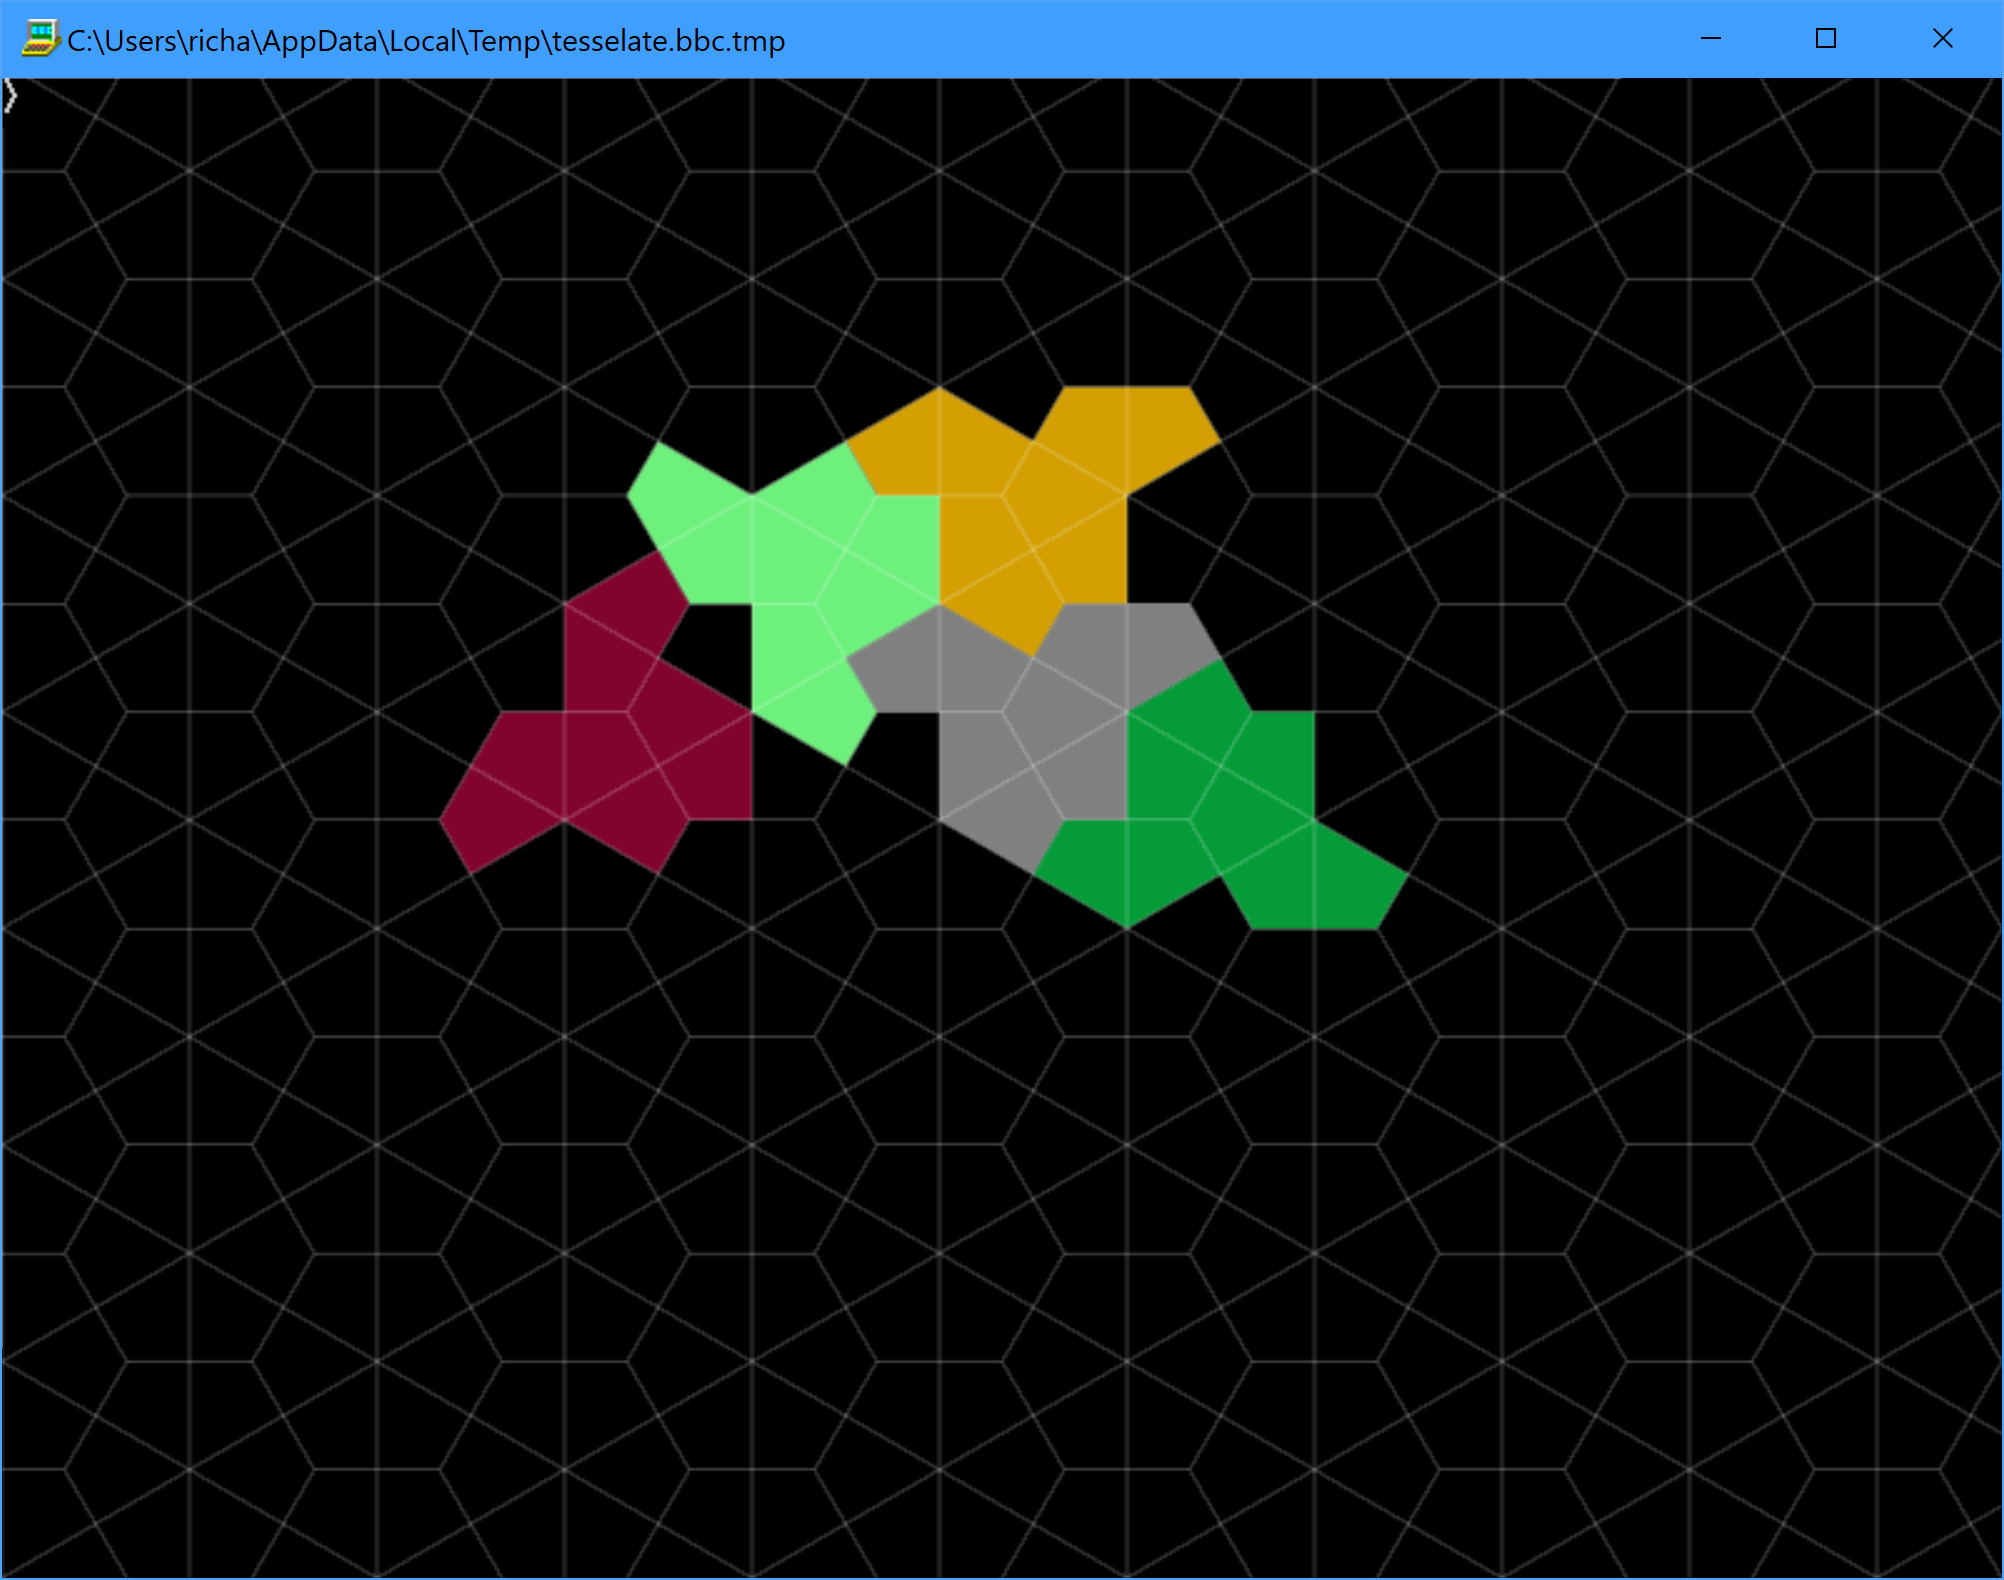
Trial-and-error doesn't work because it results in outcomes such as that shown below, where the red tile is clearly not correct because it has left a 'void' (which isn't easy to test for).
Any suggestions for how to take this forward?
It's straightforward enough to plot an individual tile (there are 6 orientations, each with a reflection, so 12 possibilities in all) but I can't figure out how to do the actual tessellation.
Trial-and-error doesn't work because it results in outcomes such as that shown below, where the red tile is clearly not correct because it has left a 'void' (which isn't easy to test for).
Any suggestions for how to take this forward?
0
Comments
-
I've a feeling that the nature of the aperiodic tiling is that you might at any time find yourself unable to continue - and you'd need to backtrack and try again. Have you read the original paper? It proceeds by subdivision rather than aggregation. They define composite shapes they call metatiles, denoted H, T, P and F (where T is a single tile, H is four tiles, and the other two are pairs.)
https://arxiv.org/abs/2303.10798
0 -
That would be annoying, but it's a lot better than what I have achieved so far! If it doesn't happen too often, one could just keep trying with a different seed.you might at any time find yourself unable to continue - and you'd need to backtrack and try again
Is this as part of the proof of aperiodicity, or do you think it's necessary simply in order to plot the tessellation (no I don't intend to try to read the paper to find out!)?They define composite shapes they call metatiles, denoted H, T, P and F (where T is a single tile, H is four tiles, and the other two are pairs.)
0 -
I think one of the ideas in there is that any valid aperiodic tiling can be decomposed into a tiling of these four metatile shapes. If that's true, then an aggregation with an interior which can't be so decomposed would be invalid, and you'd find at some point you couldn't extend it further. But you might find that out much much later. The paper is, as I recall, fairly readable.0
-
Which suggests to me that it might not be a necessary step to 'simply' drawing the tessellation (if there are also periodic solutions using that same 'hat' tile, I'm perfectly happy to end up with one; nobody would know, within the constraints of a small window).I think one of the ideas in there is that any valid aperiodic tiling can be decomposed into a tiling of these four metatile shapes.
Can you think of any relatively straightforward way to detect a 'void' (a totally enclosed region into which a tile cannot fit) so that I could reject a tile placement which results in one. Unfortunately POINT() and TINT() are extremely slow in BBCSDL so I couldn't use a brute-force technique.0 -
I believe the hat is incapable of a periodic tessellation: either it's aperiodic, or you get stuck. But of course we only ever try to create a finite patch of some size, so I'm not quite sure what logic applies.if there are also periodic solutions using that same 'hat' tile
BTW, there's a very readable account here, with some very useful links. Including links to code, if you'd like to see how others have tackled it.
0 -
-
In case anybody else thinks they might have more luck, here's the routine I wrote to plot the 'hat' tile. The parameters are as follows:
- s is a size value (typically set to around 100, a negative value causes the reflected tile to be plotted)
- x and y are Cartesian coordinates in BBC BASIC graphics units
- a is a rotation angle in radians (only multiples of PI/3 are generally useful)
- C% is the colour as &AABBGGRR
      DEF PROCplot(s, x, y, a, C%)
      LOCAL I%, d$, t$, x(), y()
      DIM x(12), y(12)
      RESTORE +1
      FOR I% = 0 TO 12
        x(I%) = x
        y(I%) = y
        READ d$, t$
        a += EVAL(t$) * SGNs
        x += EVAL(d$) * s * COSa
        y += EVAL(d$) * s * SINa
      NEXT
      PROC_aapolygon(13, x(), y(), C%)
      ENDPROC
      DATA 1, PI/2, 1/SQR3, PI/2, 1/SQR3, -PI/3, 1, -PI/2, 1, -PI/3, 1/SQR3, PI/2, 2/SQR3, -PI/3
      DATA 1/SQR3, -PI/3, 1, -PI/2, 1, PI/3, 1/SQR3, -PI/2, 1/SQR3, PI/3, 1, -PI/2
0 -
I apologise for posting a routine containing a dependency on BBC BASIC for SDL 2.0 (that is, the aagfxlib library) in the 'General BBC BASIC' section of this forum.Richard_Russell wrote: »In case anybody else thinks they might have more luck, here's the routine I wrote to plot the 'hat' tile.
I realise it would have been better to use only generic BBC BASIC code here (albeit that the result wouldn't be anti-aliased) but I don't know how to plot an arbitrary filled polygon that way.
I suppose one could decompose it into triangles but my understanding is that this isn't trivial unless the polygon is convex. How would the 'hat' tile most easily be plotted in generic BBC BASIC?
0 -
No worries - I've moved the thread to your section since the code is dependent on your implementation, and left a signpost link in General BBC BASIC.Richard_Russell wrote: »I apologise for posting a routine containing a dependency on BBC BASIC for SDL 2.0 (that is, the aagfxlib library) in the 'General BBC BASIC' section of this forum.0 -
Thanks for the code!
If you take the T shape to be four copies of a one-third hexagon, those parts are all convex. They are also all the same shape, but in different rotations, so there might not be a ready way to take advantage of that. (Perform rotations using matrices? Maybe that would be natural enough?)0 -
(Sorry, when I say T shape, I mean in this case hat shape!)0
-
There was only one post that contained non-generic code (indeed any code at all). Moving the whole thread implies that plotting the 'hat' tessellation itself isn't relevant to BBC BASIC in general. Admittedly it does seem to be difficult without a general filled-polygon plotting routine, but not impossible.No worries - I've moved the thread to your section since the code is dependent on your implementation, and left a signpost link in General BBC BASIC.
The subtitle of that section is 'General discussions on the BBC BASIC programming language' so is your objection more that it was a discussion about an application rather than the language itself?
P.S. This is a VERY bad 'This page isn't responding' day, I had to abandon posting this altogether and try again in a new tab. AdBlock Plus is still disabled on this page so it isn't the cause.0 -
Is it the case that, when two adjacent filled triangles (sharing an edge) are plotted, you can guarantee that there won't be a visible 'join'?If you take the T shape to be four copies of a one-third hexagon, those parts are all convex. They are also all the same shape, but in different rotations, so there might not be a ready way to take advantage of that. (Perform rotations using matrices? Maybe that would be natural enough?)0 -
I'm not sure about guarantee. In the past I think I've seen discussions about xor plotting, which might have highlighted the need for great care when drawing lines and filling shapes. I think, if drawing from A to B always modifies the same pixels as drawing from B to A, and if a filled triangle always includes but never overflows the corresponding unfilled triangle, then there would be no gaps.
I think, if we take as a starting point the neck of the T-shirt, or equivalently the lower-front-centre of the brim of the hat, we can draw rays to every part of the shape without crossing any edge. So, for that starting point (or any point within a certain 16th of the shape, being one of the 16 triangles making up the 4 hexagon fragments), we can fill the shape by drawing triangles. Such a starting point is, I think, the end of your fifth line segment.0 -
Back to the question
my first guess at how to backtrack is to check at each stage that the aggregation is valid. A valid aggregation is one where every free edge can have an adjoined einstein. This might be expensive: the example has some 28 free edges, and one might need to test 26 orientations of a further piece on each free edge to show that it can't fit. (My counting may be wrong, in particular I think the einstein aka hat has 14 edges, two of which are collinear.)Any suggestions for how to take this forward?
Also perhaps of interest
Two algorithms for randomly generating aperiodic tilings
0 -
Plotting adjacent triangles with any combining rule other than 'none' ('plot') typically won't give a 'seamless' result. In the special case of XOR plotting and no anti-aliasing you could in principle achieve it, but it would be a lot of effort for little benefit. Once you introduce anti-aliasing, alpha-blending and/or a combining rule such as 'add' or 'multiply' it becomes impossible.I'm not sure about guarantee. In the past I think I've seen discussions about xor plotting
So any graphics package worthy of consideration really must have a general-purpose 'filled polygon' function to make this possible. Indeed in the case of the aagfxlib library that function is the building block used to draw almost everything: lines (including dotted/dashed lines and/or lines with shaped ends such as arrows), Bézier curves, rectangles, ellipses etc.
You know my disdain for aliased graphics, in my opinion they should have died out in the last century! Unfortunately they are what BBC BASIC programmers expect from the built-in graphics (and admittedly they are much faster than anti-aliased graphics). But when speed isn't a factor, it's anti-aliased graphics every time for me.
0 -
Hmm, I see that with anti-aliased graphics the situation might be different... it would be interesting perhaps to see an example of two triangles which ought to butt up but which leave some visible imperfection along the seam.0
-
You could easily have tried it yourself:it would be interesting perhaps to see an example of two triangles which ought to butt up but which leave some visible imperfection along the seam.INSTALL @lib$ + "aagfxlib" MODE 8 DIM x(2), y(2) x() = 100, 500, 500 y() = 100, 100, 500 PROC_aapolygon(3, x(), y(), &FFFFFFFF) x() = 100, 100, 500 y() = 100, 500, 500 PROC_aapolygon(3, x(), y(), &FFFFFFFF)Definitely a visible 'seam' there. If you think about what happens on the dividing line you can see why:- After plotting the first triangle: bgd * 0.5 + fgd * 0.5 = 0.0 * 0.5 + 1.0 * 0.5 = 0.5
- After plotting the second triangle: bgd * 0.5 + fgd * 0.5 = 0.5 * 0.5 + 1.0 * 0.5 = 0.75
0 -
Ah yes, I see. (Thanks for the code!)0