Vampire Einstein aperiodic tessellation

I've written a program to plot the Vampire Einstein aperiodic monotile tessellation, and it works nicely in BBC BASIC for Windows and BBC BASIC for SDL 2.0 (below; there's an even nicer version that uses anti-aliased graphics).
But I've totally failed to make it work properly in either ARM BASIC V or Matrix Brandy BASIC because the flood-fills are leaking out and spoiling the colouring. The problem seems to be that 'plot arc' (PLOT 165) is insufficiently accurate, possibly because of the integer coordinates.
I'd be interested if anybody can fix this problem so that the native-graphics version can be published in a form which will run correctly on a range of BBC BASIC platforms.
   10 REM 'Vampire Einstein' aperiodic tessellation without reflections
   20 REM Native BBC BASIC v5+ graphics, © Richard Russell, 03-Jun-2024
   30 MODE 9 : OFF
   40 VDU 23,23,3;0;0;0;
   50 FOR C% = 1 TO 14
   60   COLOUR C%, 64+RND(160), 64+RND(160), 64+RND(160)
   70 NEXT
   80 COLOUR 15, 255, 255, 255
   90
  100 S = 3 : REM Overall scale
  110 L = S * SQR(307 + 72*SQR3)
  120 T = ATN(3 / (16/9 + SQR3))
  130
  140 FOR T% = 1 TO 45
  150   READ X, Y, A
  160   GCOL 15 : PROCvampire(X, Y, A, S)
  170   LINE 1278,0,1278,1022
  180   GCOL RND(14)
  190   FILL X - 120 * SINRADA + 50 * COSRADA, Y - 120 * COSRADA - 50 * SINRADA
  200 NEXT T%
  210 END
  220
  230 DATA 514,710,0,   662,670,0,   958,714,60,  848,311,180, 368,795,300
  240 DATA 770,776,120, 919,861,60,  881,1009,60, 1066,822,180,1212,780,180
  250 DATA 660,500,60,  258,562,240, 344,586,330, 591,244,300, 441,160,240
  260 DATA 256,392,300, 994,226,120, 959,714,300, 1213,780,180,1082,542,90
  270 DATA 1102,332,120,258,392,180, 220,710,240, 148,286,300, 220,708,120
  280 DATA 98,882,270,  332,1114,0,  478,1072,0,  1106,628,0,  1252,416,60
  290 DATA 1032,78,240, 886,120,0,   738,159,0,   480,11,240,  38,178,300
  300 DATA 110,432,180, 296,200,0,   1180,162,300,-112,94,240, 58,-30,270
  310 DATA 1068,-70,240,74,794,180,  110,431,60,  688,1094,30, 1362,694,120
  320
  330 DEF PROCvampire(x, y, a, s)
  340 LOCAL I%, d : LOCAL DATA
  350 RESTORE +1
  360 FOR I% = 1 TO 7
  370   READ d : d += a
  380   x += L * SIN(T + RAD(d))
  390   y += L * COS(T + RAD(d))
  400   PROCside(x, y, d, s)
  410   READ d : d += a
  420   PROCside(x, y, d, s)
  430   x -= L * SIN(T + RAD(d))
  440   y -= L * COS(T + RAD(d))
  450 NEXT
  460 ENDPROC
  470
  480 DATA 80,170,50,320,200,290,170,350,230,140,260,170,290,200
  490
  500 DEF PROCside(x, y, a, s)
  510 LOCAL r, d, xc, yc : r = 9 * s : d = 8 * s
  520 LINE x, y, x - d*SINRADa, y - d*COSRADa
  530 xc = x - d*SINRADa - r*COSRADa : yc = y - d*COSRADa + r*SINRADa
  540 MOVE xc,yc : MOVE xc + r*COSRAD(a+125), yc - r*SINRAD(a+125)
  550 PLOT 165, x - d*SINRADa, y - d*COSRADa
  560 ENDPROC
0
Comments
-
That's a very nice program. How to fix it... as all the angles are in degrees, I wonder if using a function, say SIN in terms of COS, so that SIN and COS are precisely 90 degrees apart would help at all - pushing the irrationality of PI further away, as it were. Does the arc plotting hit different pixels depending on the direction of the arc? Is there a simple way to draw the lines 2 pixels wide, I wonder (for example, drawing the edges four times, offsetting the origin to hit four vertices of a one-pixel square)?
I'm not quite in a position to experiment right now...
Edit: for reference, the Spectre paper is here.0 -
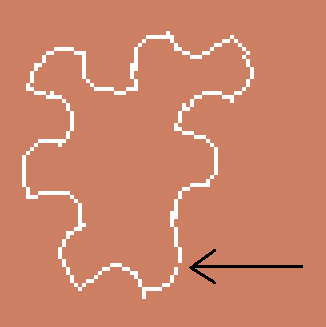
Here's Matrix Brandy's rendering of just one of the Vampire Einstein tiles, with the hole indicated. There's just the one hole, I think, but that's enough for the flood fill to leak out. How can the code be modified to ensure there are no holes, please?
0 -
Is that the first and last points of the perimeter not joining up, or is that in the middle of the chain?0
-
I did notice that the value of T is 1/SQR2, but has come out to only four or five digits accuracy. Not sure if that's enough to be a root cause.0
-
I must admit I don't understand that (I'm not a mathematician). The calculations in the program must be accurate to something like 1/1000 pixel, so how are they contributing to the problem?I wonder if using a function, say SIN in terms of COS, so that SIN and COS are precisely 90 degrees apart would help at all - pushing the irrationality of PI further away, as it were.
Probably, but since BBC BASIC's graphics only plot arcs counter-clockwise I don't see the relevance.Does the arc plotting hit different pixels depending on the direction of the arc?
In BB4W and BBCSDL yes:Is there a simple way to draw the lines 2 pixels wideVDU 23,23,2|
But it's not supported in the versions that are misbehaving.
I guess that should work, yes. A bit brute-force, but practical. I'll try it.I wonder (for example, drawing the edges four times, offsetting the origin to hit four vertices of a one-pixel square)?
0 -
I confess to being thoroughly mystified by that comment. T happens to have a value close to 1/SQR2 but it isn't 1/SQR2 (it's an angle in radians so that would make no sense geometrically).I did notice that the value of T is 1/SQR2, but has come out to only four or five digits accuracy. Not sure if that's enough to be a root cause.
When run in Matrix Brandy or ARM BASIC VI T should be accurate to something like 14 decimal digits, perhaps more (in BB4W it will be something like 18 digits). It can't be significantly less accurate than that.
So I don't see where your reference to "only four or five digits accuracy" comes from. Are you basing it purely on a coincidental similarity between two different constants?0 -
Yes, that works:Hated_moron wrote: »10 REM 'Vampire Einstein' aperiodic tessellation without reflections 20 REM Native BBC BASIC v5+ graphics, © Richard Russell, 04-Jun-2024 30 MODE 9 : OFF 40 FOR C% = 1 TO 14 50 COLOUR C%, 64+RND(160), 64+RND(160), 64+RND(160) 60 NEXT 70 COLOUR 15, 255, 255, 255 80 90 S = 3 : REM Overall scale 100 L = S * SQR(307 + 72*SQR3) 110 T = ATN(3 / (16/9 + SQR3)) 120 130 FOR T% = 1 TO 45 140 READ X, Y, A 150 GCOL 15 : PROCvampire(X, Y, A, S) : PROCvampire(X+2, Y, A, S) 160 PROCvampire(X, Y+2, A, S) : PROCvampire(X+2, Y+2, A, S) 170 LINE 1278,0,1278,1022 180 GCOL RND(14) 190 FILL X - 120 * SINRADA + 50 * COSRADA, Y - 120 * COSRADA - 50 * SINRADA 200 NEXT T% 210 END 220 230 DATA 514,710,0, 662,670,0, 958,714,60, 848,311,180, 368,795,300 240 DATA 770,776,120, 919,861,60, 881,1009,60, 1066,822,180,1212,780,180 250 DATA 660,500,60, 258,562,240, 344,586,330, 591,244,300, 441,160,240 260 DATA 256,392,300, 994,226,120, 959,714,300, 1213,780,180,1082,542,90 270 DATA 1102,332,120,258,392,180, 220,710,240, 148,286,300, 220,708,120 280 DATA 98,882,270, 332,1114,0, 478,1072,0, 1106,628,0, 1252,416,60 290 DATA 1032,78,240, 886,120,0, 738,159,0, 480,11,240, 38,178,300 300 DATA 110,432,180, 296,200,0, 1180,162,300,-112,94,240, 58,-30,270 310 DATA 1068,-70,240,74,794,180, 110,431,60, 688,1094,30, 1362,694,120 320 330 DEF PROCvampire(x, y, a, s) 340 LOCAL I%, d : LOCAL DATA 350 RESTORE +1 360 FOR I% = 1 TO 7 370 READ d : d += a 380 x += L * SIN(T + RAD(d)) 390 y += L * COS(T + RAD(d)) 400 PROCside(x, y, d, s) 410 READ d : d += a 420 PROCside(x, y, d, s) 430 x -= L * SIN(T + RAD(d)) 440 y -= L * COS(T + RAD(d)) 450 NEXT 460 ENDPROC 470 480 DATA 80,170,50,320,200,290,170,350,230,140,260,170,290,200 490 500 DEF PROCside(x, y, a, s) 510 LOCAL r, d, xc, yc : r = 9 * s : d = 8 * s 520 LINE x, y, x - d*SINRADa, y - d*COSRADa 530 xc = x - d*SINRADa - r*COSRADa : yc = y - d*COSRADa + r*SINRADa 540 MOVE xc,yc : MOVE xc + r*COSRAD(a+125), yc - r*SINRAD(a+125) 550 PLOT 165, x - d*SINRADa, y - d*COSRADa 560 ENDPROC
0 -
There has been a suggestion that the calculations in the program might be contributing to the issue, rather than it resulting solely from shortcomings in the plotting. I am confident that they don't: everything is calculated with the native accuracy of BBC BASIC, so that's 64-bit doubles in the case of Brandy (around 15 significant figures); no approximations are involved.
But as a picture can be more convincing than words, I've plotted (below) the outline of one Vampire Einstein tile, using the same code, with a relatively high resolution. Even the tiniest errors in the values of L or T would show up, especially given how they would accumulate on each of the 14 'sides': 0
0 -
It's definitely the plotting granularity. The original program works in MODE 20 (640x512, 16 colours), and the newer one fails in MODE 2.0
-
MODE 2 is very low resolution and doesn't even have square pixels, so I tend to omit it from consideration (the program relies on version 5 BASIC anyway, so requires at least an Archimedes to run, ignoring Second Processors).The original program works in MODE 20 (640x512, 16 colours), and the newer one fails in MODE 2.
MODE 9 is my preferred mode when writing code designed to run on a range of platforms, including Acorn and Brandy, because it's the highest resolution 16-colour mode reasonably compatible with BB4W and BBCSDL.
Mode numbers from 10 upwards are completely incompatible (for example MODE 20 is 800 x 600 in my BASICs, not 640 x 512), so must be avoided in cross-platform programs. In my BASICs MODE 8 will give you 640 x 512 in 16 colours anyway (if you avoid PLOT 69 and UDCs).
0 -
I've only skimmed through it, but I can't actually find a detailed description of the tile's shape there at all! Only the vague comment that the "tile boundaries are modified in a manner similar to Figure 1.1".Edit: for reference, the Spectre paper is here.
I worked out what the shape must be from the published image and the requirement that it create a closed figure if iterated around the 14 (curved) 'sides'.
0 -
Is it the case that every tile has a perimeter gap, or only some tiles? Can you perhaps draw each of the 14 sides in different colours and see where the gap arises? Is it always at the same vertex?
I had a play and it looked at first like the sixth tile drawn is the first with a harmful gap, which is not at the beginning/end of the perimeter but towards the end.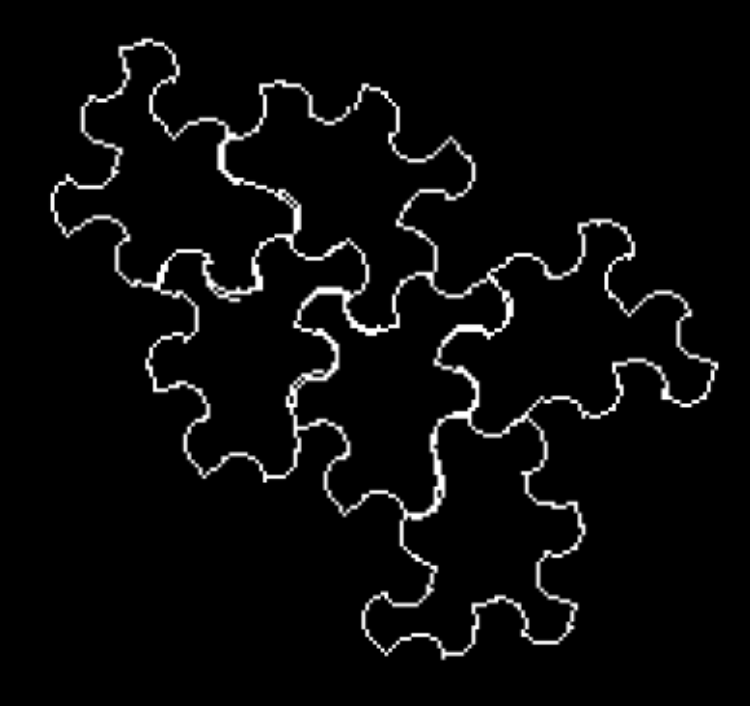
But on drawing the tiles individually I see the fifth is the first to have a gap:
Looks like (in my environment) it's the 66th call to PROCside which produces a gap - which is between the line and the arc.
I threw in some PRINTs505 PRINT ;sss" "x" "y" "a" "s 520 PRINT ;x" "y" "x - d*SINRADa" "y - d*COSRADa 544 PRINT ;xc" "yc" "xc + r*COSRAD(a+125)" "yc - r*SINRAD(a+125)
and saw this: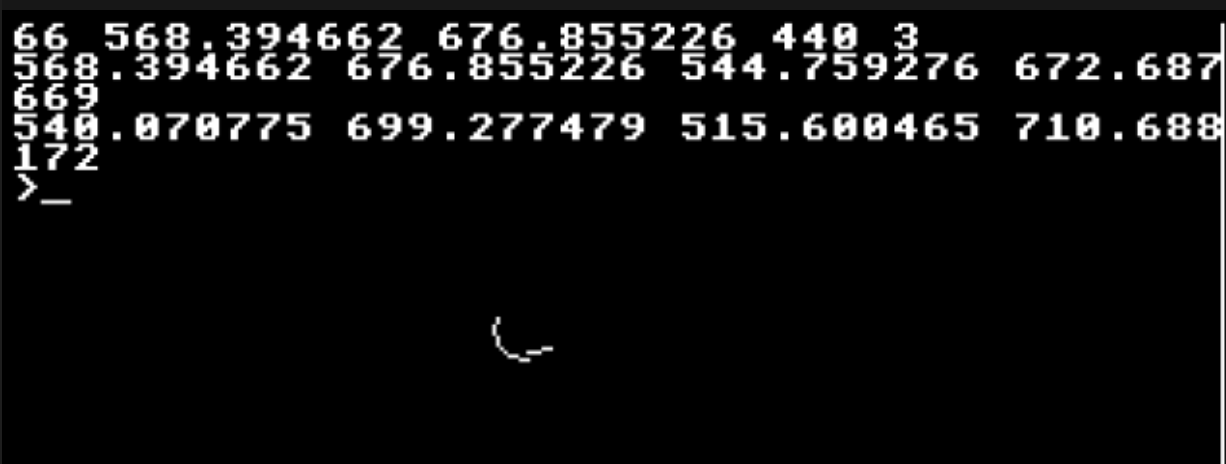
0 -
(BTW, the above is by way of a possible idea for investigating - it's not a conclusion, and the results in your environment might possibly be different. By tweaking the code I could choose how many tiles to plot, and which to fill, and see where it went wrong.)
For the tile vertex coordinates, I think perhaps you can view the spectre tile as a perturbation of the original aperiodic monotile, which sits nicely on a hex grid:
See the paper (pdf here)0 -
My assumption is that it's not to do with which (ordinal) side it is but rather with at what angle the side is drawn.Is it the case that every tile has a perimeter gap, or only some tiles?
There are 12 possible orientations for a side, at multiples of 30° (there are also 12 possible orientations of the tile itself, also in multiples of 30°). So I expect sides at some angles have 'holes' whilst those at other angles don't.
But I've not tried to confirm that, because even if true it probably doesn't help 'solve' the problem.
A property of BBC BASIC's graphics is (supposed to be) that when drawing a straight line between two points, the end-points are definitely both plotted. If the same guarantee was made about an arc it ought to be possible to ensure there are no 'holes', but it isn't.
0 -
Umm, I might be wrong there. A better presentation of the Spectre shape is perhaps here:
https://www.chiark.greenend.org.uk/~sgtatham/quasiblog/aperiodic-spectre/
0 -
What I take away from both that and the original Spectre paper is that the precise shape of the 'curves' (which make it 'strongly chiral' hence ruling out a periodic tessellation) may not be uniquely determined, so long as the 'convex' sides on one tile mesh with the 'concave' sides on another.A better presentation of the Spectre shape is perhaps here:
https://www.chiark.greenend.org.uk/~sgtatham/quasiblog/aperiodic-spectre/
0 -
Yes, I get the same idea.
BTW, I tried my test program in SDL version and that particular call to PROCside has [very very nearly] the same inputs (as you might expect) but produces a continuous shape. So it feels to me like you might have found some edge-case in the graphics routines, which are triggered in different circumstances between platforms, but exist in more than one. Particularly, cases where an arc and a line which ought to meet up don't meet up.0 -
I'd go further, and suggest that it's not an "edge case" but just a characteristic of the plotting routines that when drawing an arc of an arbitrary length at an arbitrary angle there simply is no guarantee that both 'end points' will be drawn.So it feels to me like you might have found some edge-case in the graphics routines, which are triggered in different circumstances between platforms, but exist in more than one.
After all you only explicitly provide the coordinates of one end point (and it may be that is guaranteed to be drawn, I don't know) since the other end of the arc is specified by a radius line, not a point. It doesn't necessarily intersect the perimeter at the centre of a pixel anyway, so 'end point' isn't well-defined.
0