Strange heap-alignment sensitivity
![[Richard Russell]](https://distillery.matrixnetwork.co.uk:3004/applications/dashboard/design/images/defaulticon.png)
This is a real mystery. Running the Windows edition of BBC BASIC for SDL 2.0 (coded in assembly language) I'm noticing an extreme execution-speed sensitivity to heap alignment.
Specifically, the program concerned runs very slowly if LOMEM-PAGE is one of the following values, but otherwise it runs at its normal speed:
This is consistent and reproducible on my laptop but doesn't seem to happen at all on my desktop PC (they are both Core i7 CPUs).
This is so strange I'm wondering if it is a hardware fault of some kind, but I'd be interested in any insight others can offer.
Specifically, the program concerned runs very slowly if LOMEM-PAGE is one of the following values, but otherwise it runs at its normal speed:
795-798 bytes inclusive
859-863 bytes inclusive
923-926 bytes inclusive
etc.
In other words, for every 64-bytes increase in the value of LOMEM there is a block of 4 consecutive values when the program runs very slowly! With the other 60 values it is fine.
This is consistent and reproducible on my laptop but doesn't seem to happen at all on my desktop PC (they are both Core i7 CPUs).
This is so strange I'm wondering if it is a hardware fault of some kind, but I'd be interested in any insight others can offer.
0
Comments
-
64 bytes is the size of a cache line in the Core i7 family, which I bet is significant.Richard_Russell wrote: »for every 64-bytes increase in the value of LOMEM there is a block of 4 consecutive values when the program runs very slowly
0 -
Do you get the same when running in Linux, ideally on the same hardware?0
-
My laptop is Windows 11 only, so that's not something I can easily test. I expect you'll suggest I boot 32-bit Linux from an external drive, but I'm not inclined to go to that trouble unless it has some diagnostic value. Can you think of a possible cause other than a hardware fault?Do you get the same when running in Linux, ideally on the same hardware?
0 -
Seems unlikely to me to be a fault, so I would expect alignment is the answer.0
-
Can you expand on that please? I'm seeing a massive slowdown (it could be as much as a factor of 10 or more), what conceivable 'alignment' issue could cause that?I would expect alignment is the answer.
My code doesn't align anything with a coarseness greater than the 16 bytes alignment required by some SSE instructions, yet this is happening with a periodicity of 64 bytes (and the code involved doesn't use SSE anyway).
The only time I've seen a slowdown of a comparable magnitude previously has been when the SMC (Self Modifying Code) provision has been inadvertently activated by BBC BASIC assembler code.
0 -
It's just my best guess. Hardware failures can be extremely data sensitive - unless you can test on different hardware or a different OS, or get fine grained results from carefully constructed tests, I'm not sure how you can resolve the question. Note that "core i7" covers a number of different microarchitectures, and laptop vs desktop is going to cover more differences, so probably not telling us much.0
-
Oh well, thanks anyway. The effect is so dramatic that just to put it down to 'one of those things' and not to be able to come up with even a pragmatic workaround is highly unsettling.I'm not sure how you can resolve the question.
Just for the record here are two partial profiler reports, the first for the 'fast' condition when everything is happening as it should, and the second for the anomalous 'slow' condition:6: 0.08 470 FOR a = 0 TO 2*PI STEP 0.0009 1856: 24.37 480 i = PI*(SIN(a+j)+COS(2*a+k)) 1618: 21.24 490 X% = &140 + &DC*SINa*SIN(i+z) 1406: 18.46 500 Y% = &100 + &C8*COSa*COSi 662: 8.69 510 xy2%(I%,0) = X% : xy2%(I%,1) = &200 - Y% 614: 8.06 520 xy1%(I%,0) = X% : xy1%(I%,1) = Y% 128: 1.68 530 I% += 1 140: 1.84 540 NEXTNote that lines 510 and 520, which do very similar things, take similar times.0: 470 FOR a = 0 TO 2*PI STEP 0.0009 238: 3.13 480 i = PI*(SIN(a+j)+COS(2*a+k)) 218: 2.86 490 X% = &140 + &DC*SINa*SIN(i+z) 266: 3.49 500 Y% = &100 + &C8*COSa*COSi 134: 1.76 510 xy2%(I%,0) = X% : xy2%(I%,1) = &200 - Y% 6390: 83.95 520 xy1%(I%,0) = X% : xy1%(I%,1) = Y% 26: 0.34 530 I% += 1 94: 1.23 540 NEXTHere line 520 is taking nearly 50 times as long as the very similar line 510!1 -
Just a thought: you perhaps could do an early DIM of 1 to 4 bytes, to push local data structures around (above TOP), and see if TOP alignment, rather than program alignment, is important. Unless, of course, the dependency of LOMEM-PAGE already shows that... in which case perhaps an early REM, with 1-4 bytes of padding, can show that it's program alignment which is important.0
-
That's exactly what I do in my test program: I (effectively) increase LOMEM by one byte, run the program for one second, increase it by another byte, run the program for another second and so on, whilst noting the execution times. That's how I know that (1) it's 4 consecutive bytes out of every 64 which trigger the problem and (2) it's the heap alignment, not the program code or the stack, that matters.perhaps could do an early DIM of 1 to 4 bytes, to push local data structures around (above TOP)
0 -
It very much sounds like a 4-byte-sized object straddling two cache lines. Can you perhaps fiddle with the datatypes and conjure up a different size of object?
The 50x execution penalty certainly is very striking. Does a very short program suffer the same fate? I could run on linux or on macos, preferably in console mode. If the program isn't self-measuring I'd need instructions for how to profile.0 -
There are two snags with that theory! First, by my reckoning it would result in three, not four failing addresses (e.g. it would straddle the boundary at 64 if starting at 61, 62 or 63 but not when starting at 60 or 64).It very much sounds like a 4-byte-sized object straddling two cache lines.
Second, there must be at least 13 consecutive bytes accessed on the heap by the statement that is misbehaving (the link, the variable's name and the variable's value), not 4.
The program is quite short, but I've not experimented with how short it can be made and still misbehave.Does a very short program suffer the same fate?
It is self-measuring, but is currently Windows only.If the program isn't self-measuring I'd need instructions for how to profile.
0 -
Hmm, good points.0
-
I can reproduce the behaviour with a minimal program. It requires only that two variables starting with the same letter (and hence sharing the same linked-list) be accessed alternately, for example:Hmm, good points.FOR I% = 0 TO 19999 x1% = FALSE x2% = FALSE NEXTChange the x2% to y2% and everything is fine, there's no alignment sensitivity. Does that suggest anything to you?1 -
I ran this, on Mac M1 and on Linux x86_64, and didn't see any anomalous values.
   10 J%=J%+1
   20 DIM X J%
   30 T=TIME
   40 FOR I% = 0 TO 19999999
   50   x1% = FALSE
   60   x2% = FALSE
   70 NEXT
   80 PRINT J%;" ";TIME-T
   90 IF J%<66 RUN
Linux machine was
quite flat within ±10%model name : Intel(R) Core(TM) i5-3210M CPU @ 2.50GHz ((Ivy bridge) mobile)
Let me find another machine...model name : Intel Xeon Processor (Skylake, IBRS) cpu MHz : 2095.076
again, quite flat within ±10%
and another...Intel Xeon E5-2650 v3 @ 2.30 GHz (Ivy Bridge (Server))
quite flat within ±12%
Which doesn't rule out something special with your desktop CPU microarchitecture, or indeed a hardware problem.0 -
Could you perhaps give more detail as to which CPU model you have? (Is it possible that external memory configuration is important? One might ask how many DIMMs you have, and what capacity and speed is each, but of course that might be a bother to find out.)0
-
So, looking at the code of the interpreter, the difference is that this code is executed in the 'slow' case but not the 'fast' case:Richard_Russell wrote: »Change the x2% to y2% and everything is finexchg eax,[ebx]
As you may know, exchanging a register with memory is a 'special case' x86 instruction because it is guaranteed to be atomic. In a multicore or multi-CPU system, another CPU cannot access the memory location between the 'read' and the 'write', there is an implied lock.
Experimentally I have tried replacing the above instruction with this equivalent (but bigger, and potentially slower) code:xor eax,[ebx] xor [ebx],eax xor eax,[ebx]
and, indeed, the alignment anomaly doesn't occur in this case. But that doesn't explain why it does occur with the original code, and nor would the substitution be sensible generally because in most situations it will actually slow down the code.
0 -
You won't, because you're using the interpreter coded in C when the problem affects only the assembly language interpreter. Try it using 32-bit BBC BASIC.I ran this, on Mac M1 and on Linux x86_64, and didn't see any anomalous values.
Intel Core i7 1260U Alder LakeCould you perhaps give more detail as to which CPU model you have?0 -
Ah, right. Looks like you have some kind of answer already - it's (most likely) not a hardware failure, it's a peculiarity of that particular atomic opcode on your CPU when something cache-line related is going on.0
-
It looks like the atomic xchg is known to be slow, in some sense, and so the three xor could even be faster. Is there no spare register to allow you to use mov instructions?0
-
Isn't a "peculiarity of that particular opcode" that is sufficient to cause a massive slow-down (far more than could be explained by any 'normal' side effect) a "hardware failure"? Surely Intel CPUs don't have bugs of that magnitude which one just has to 'accept' as normal?it's (most likely) not a hardware failure, it's a peculiarity of that particular atomic opcode on your CPU when something cache-line related is going on.
How do you figure that out? The slowdown happens only in exceptional circumstances (bear in mind that I encountered it only a few days ago after more than 22 years of running that interpreter) whilst replacing the code with the alternative will slow everything down always. That doesn't seem a good tradeoff at all (and no there are no spare registers)!It looks like the atomic xchg is known to be slow, in some sense, and so the three xor could even be faster.
0 -
It could be interesting to measure, as performance these days is not easily estimated, even if one instruction is replaced by three. Similarly, if you have a short test case there might be forums where people with various CPUs would be happy to run tests.0
-
I can't do a direct test, because adding even one byte to the code size (let alone four) will make any overall timing comparison meaningless - because code alignment is crucial to performance too. It's why making any modifications at all to the assembly-language interpreter is fraught with difficulty because changes mustn't increase the code size!It could be interesting to measure, as performance these days is not easily estimated, even if one instruction is replaced by three.
You'd probably be surprised at what changes I have been able to make over the years, given that restriction, but there are no obvious opportunities for a zero-size-increase change in the region of code involved in this issue, which is the most critical code in the entire interpreter and has been optimised to death.
I'll probably leave things as they are, given the rarity of the issue and the ultra-high-risk nature of any changes in this region of the code, which hasn't been touched for well over a decade.
0 -
Here's a little test program that you can run on your x64 platforms:I ran this, on Mac M1 and on Linux x86_64DIM gap%% 2048, ]^P% 100, gap%% 2048, mem%% 68 [ .test mov rbx,[rel ^p%%] mov ecx,1000000 .more xchg eax,[rbx] loop more ret ] @% = 20 PRINT FOR I% = 0 TO 63 p%% = mem%% + I% TIME = 0 : X% = USR(test) : T% = TIME PRINT RIGHT$(" "+STR$I%,4) " : "; T%,; NEXTHere it shows that a single xchg eax,[rbx] instruction, straddling two cache lines, takes about 13 microseconds! That's a lot slower even than the 6502 in the BBC Micro, and you're not going to convince me that it's an 'expected' side-effect of an unaligned access, especially when you consider that an unaligned xchg instruction is not atomic, and no guarantees are given that it will do anything other than a couple of regular memory loads and saves.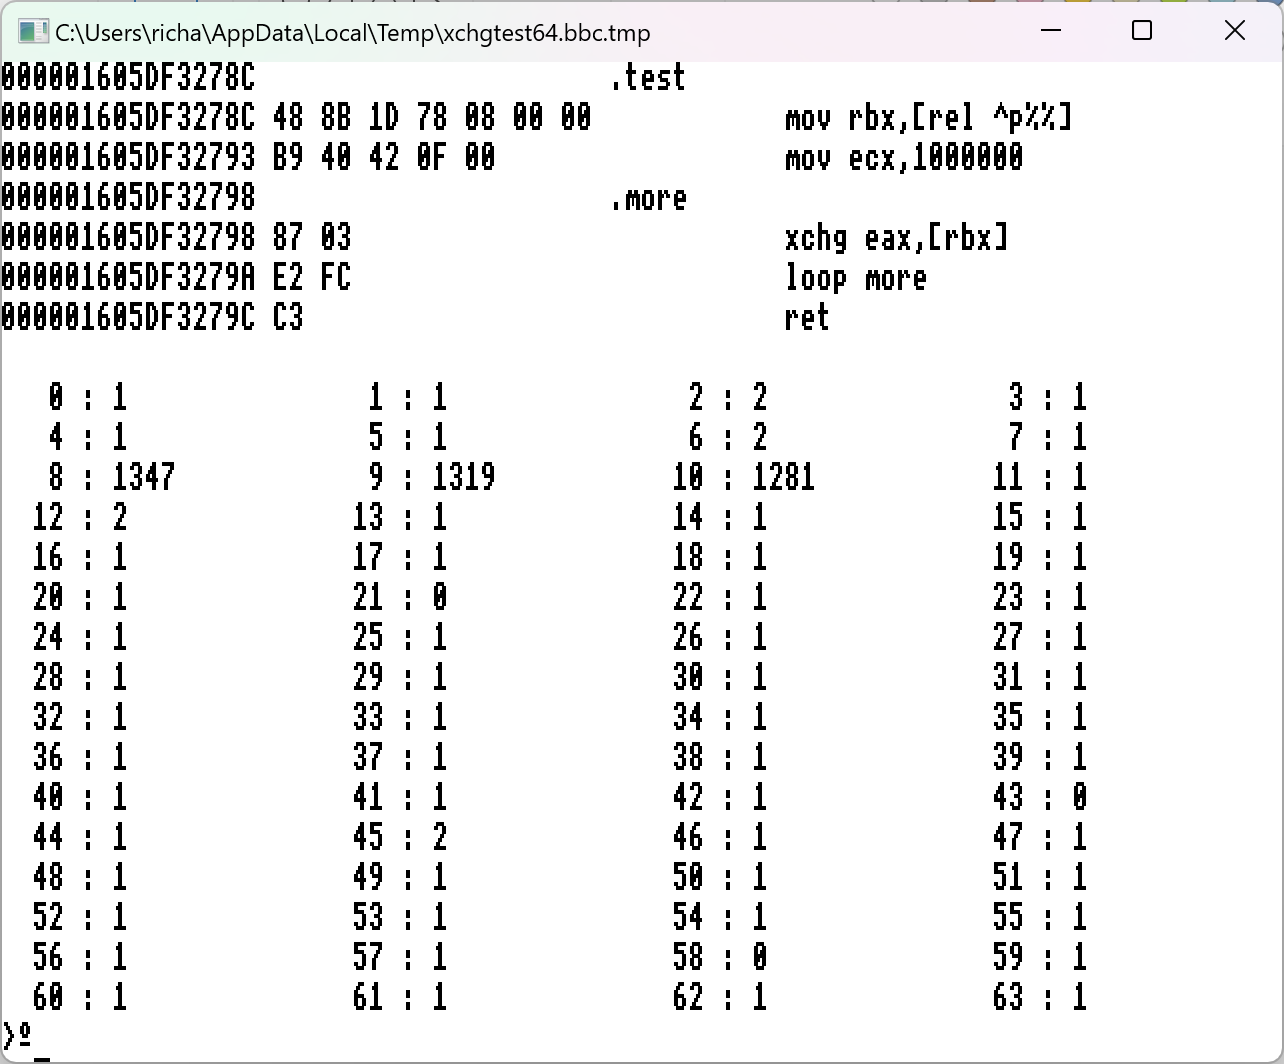
0 -
Very interesting. I think the story I'd tell would go something like this
- in the original simple x86 where we had one CPU core in a chip, memory at similar speeds to CPU, and usually only one CPU in a system, xchg was not terribly slow
- in later complex x86 with multiple CPUs and with memory much slower, xchg becomes very costly
- at some later point, Intel managed to speed up xchg in 60 out of 64 cases, and were very pleased to do so
See the commentary at
https://stackoverflow.com/questions/74119710/efficiency-when-swapping-array-contentsFun fact: it was apparently only 386 that introduced the implicit lock semantics. xchg with memory wasn't slow on old CPUs:
https://www2.math.uni-wuppertal.de/~fpf/Uebungen/GdR-SS02/opcode_i.html
...
The atomic RMW is a perf disaster on modern CPUs
See also Agner Fog (pdf):A LOCK prefix typically costs more than a hundred clock cycles, even on single-processor systems. This also applies to the XCHG instruction with a memory operand.0 -
One hundred clock cycles, fine. I could accept that as a 'normal' overhead for bus locking (although I would remind you that an unaligned xchg does not do a lock, only aligned accesses do).See also Agner Fog:A LOCK prefix typically costs more than a hundred clock cycles, even on single-processor systems. This also applies to the XCHG instruction with a memory operand.
But I am seeing not 100 cycles but around 20,000 cycles; let me say that again: twenty thousand clock cycles for one instruction! You seem determined to consider that 'reasonable' but I can't agree.
I think you should at least consider the possibility that Intel is not as infallible, and I am not quite as stupid, as you prefer to believe.
0 -
Please be assured, Richard, that I don't believe either of those things.
Thanks for your x86 assembly version - I ran that on the old linux laptop (2012 vintage, Intel(R) Core(TM) i5-3210M CPU @ 2.50GHz, has 3MB of L3 cache with 64 byte lines, fitted with 2 DIMMs each 4GB of 64 bit DDR3, 1600MT/s), and got these results, repeatably:0 : 1 1 : 1 2 : 1 3 : 1 4 : 1 5 : 0 6 : 1 7 : 1 8 : 1 9 : 1 10 : 1 11 : 0 12 : 1 13 : 1 14 : 1 15 : 0 16 : 1 17 : 1 18 : 1 19 : 1 20 : 0 21 : 1 22 : 1 23 : 1 24 : 1 25 : 1 26 : 1 27 : 0 28 : 84 29 : 83 30 : 85 31 : 2 32 : 1 33 : 0 34 : 1 35 : 1 36 : 1 37 : 0 38 : 1 39 : 1 40 : 0 41 : 1 42 : 1 43 : 1 44 : 1 45 : 1 46 : 1 47 : 1 48 : 0 49 : 1 50 : 1 51 : 1 52 : 1 53 : 0 54 : 1 55 : 1 56 : 1 57 : 1 58 : 1 59 : 1 60 : 1 61 : 0 62 : 1 63 : 1
0 -
Running on the Intel Xeon E5-2650 v3 @ 2.30 GHz (Ivy Bridge (Server) - or, edit, Haswell) machine, I get slightly variable but pretty consistent results like this:
   0 : 1               1 : 1               2 : 1               3 : 1
   4 : 1               5 : 1               6 : 1               7 : 1
   8 : 1               9 : 2              10 : 1              11 : 1
  12 : 1              13 : 1              14 : 1              15 : 1
  16 : 0              17 : 1              18 : 1              19 : 1
  20 : 1              21 : 1              22 : 1              23 : 1
  24 : 1              25 : 1              26 : 1              27 : 1
  28 : 480            29 : 501            30 : 622            31 : 1
  32 : 1              33 : 1              34 : 1              35 : 1
  36 : 1              37 : 1              38 : 1              39 : 1
  40 : 1              41 : 1              42 : 1              43 : 2
  44 : 1              45 : 1              46 : 1              47 : 1
  48 : 1              49 : 1              50 : 2              51 : 1
  52 : 2              53 : 1              54 : 2              55 : 2
  56 : 1              57 : 1              58 : 2              59 : 2
  60 : 2              61 : 1              62 : 2              63 : 1
Edit: by pretty consistent, I mean a second run came up with this:28 : 632 29 : 654 30 : 513 31 : 1
0 -
(Noting that my older CPU is 2 core and that much newer one is 8 core, with 20MB of L3 cache. That's a larger memory system on chip, so perhaps not too surprising that it is slower. But possibly it's off-chip accesses which are important here. Is your system a multi-socket system?)0
-
Running on the Skylake (16MB of L3, probably 12 cores)
   0 : 1               1 : 1               2 : 1               3 : 1
   4 : 2               5 : 2               6 : 1               7 : 1
   8 : 1               9 : 1              10 : 1              11 : 1
  12 : 1              13 : 1              14 : 1              15 : 1
  16 : 1              17 : 1              18 : 1              19 : 1
  20 : 1              21 : 1              22 : 1              23 : 1
  24 : 1              25 : 1              26 : 1              27 : 1
  28 : 449            29 : 449            30 : 450            31 : 1
  32 : 1              33 : 1              34 : 1              35 : 1
  36 : 1              37 : 1              38 : 1              39 : 1
  40 : 1              41 : 1              42 : 1              43 : 1
  44 : 2              45 : 1              46 : 1              47 : 1
  48 : 1              49 : 1              50 : 2              51 : 1
  52 : 1              53 : 1              54 : 1              55 : 1
  56 : 1              57 : 1              58 : 1              59 : 1
  60 : 1              61 : 1              62 : 1              63 : 1
0 -
(A note in passing, I see there's also a similar but different pattern of alignment sensitivity on my Mac M2 running the x86 code with Rosetta2. Perhaps because the common case is handled as a fast path. Anyhow, in this case it repeats over each 16 addresses rather than each 64.)0